
Jet Engine Remaining Useful Life
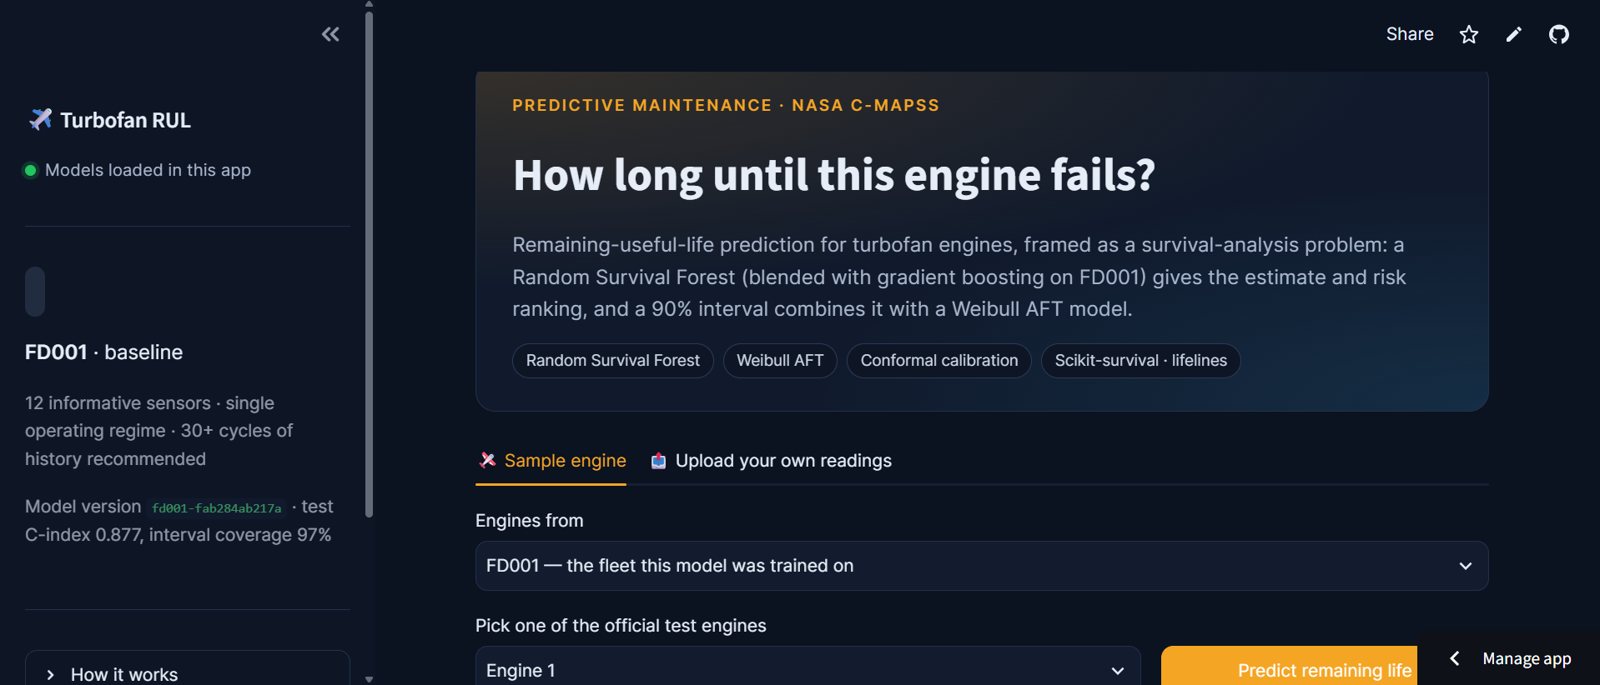
How long until this engine fails? Remaining-useful-life prediction on NASA C-MAPSS, framed as survival analysis so every estimate ships with a calibrated 90% interval a maintenance planner can trust.
The problem
Airlines remove engines for maintenance on a schedule or after a fault, and both are expensive. A planner needs to know how many cycles an engine has left, with an honest range around it, early enough to plan the work.
A point estimate alone is not enough. “80 cycles” is useless if the true value could be 20.
The data
NASA’s C-MAPSS run-to-failure dataset. The model is trained on FD001: one operating regime, one fault mode and 21 sensor channels per cycle, of which 12 carry useful signal. Each engine starts healthy and degrades until it fails.
The approach
- I framed RUL as survival analysis rather than plain regression, so the model reasons about the probability of failure over time.
- A Random Survival Forest, blended with gradient boosting, gives the point estimate and ranks engines by risk.
- A Weibull AFT model provides a parametric view of the failure-time distribution.
- Conformal calibration combines the two into a 90% prediction interval with a coverage guarantee.
Results
| Metric | Test | What it means |
|---|---|---|
| C-index | 0.877 | Orders which of two engines fails first correctly 87.7% of the time |
| 90% interval coverage | 97% | The true RUL fell inside the stated range for 97% of test engines |
The app
Pick any official test engine or upload your own sensor readings and get the remaining-life estimate, its interval and a risk ranking. Models are versioned on the Hugging Face Hub and loaded inside the app, which keeps the demo free and public.